
Whether you’re in the marketing department at an enterprise company with a dedicated content team or at a small- to medium-sized business or startup just wading into the waters of content marketing, one question you’re going to have to answer is: What is the value of your content?
And that question will immediately spawn a second question: How can we measure it? Some marketers may argue that what content brings to your business is amorphous and difficult to measure. And, while we don’t totally disagree, we do think there’s a way to begin to calculate the performance of your content from a bigger business perspective. To get there, we need to first consider the overarching purpose and the larger impact of content.
A note on the methodology here: While you can measure performance of content via the channels on which you distribute it (social media, email, paid advertising, paid search, etc.), we’re focusing here on how to show the value of content through website metrics.
What is the purpose of content?
Quality content is a handshake, an ongoing conversation, the first date (and often the second and third) with potential customers or clients. It serves four essential functions:
- Increases your target audience’s perception of your brand
- Adds substance and value to marketing and advertising campaigns
- Draws your target audience to your website in a steady stream through smart distribution and SEO
- Enriches your sales team’s prospect communications with value-add pieces
Given that wide range of functions and potential impact, we have arrived at the most challenging question…
How can we measure the true value of content?
We can do so by zeroing in on a few key indicators:
- Engagement metrics
- Content completion rate
- Increase in qualified traffic
Simply measuring the total number of people who arrived at your content offers little insight. The questions that matter are:
How are users engaging with the content?
Are the right people getting there?
With the following metrics, we can measure just that.
Engagement Metrics:
Not all analytics are created equal
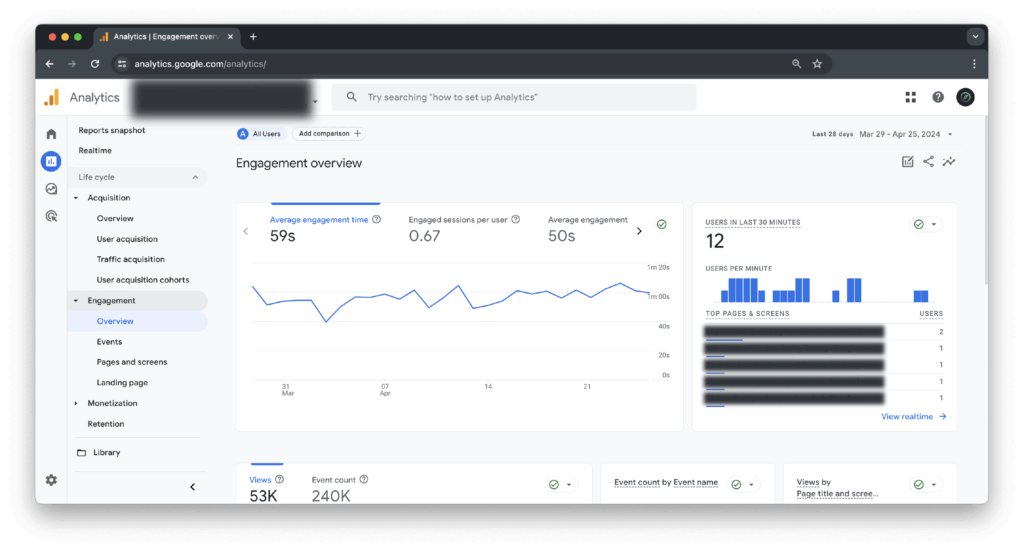
The KPIs that will give you the most insight into how users are engaging with your content are:
- Average session duration
- Scroll depth
- Average pages per session
- Clickthrough rate
- Form completion
Make sure to track and measure these metrics to see how they trend over time — and use the findings to optimize your strategy. But the most important of all engagement metrics is the one that comes next.
Content Completion Rate:
The more complex but most telling number

Content completion rate is a lesser-known KPI that can tell you more than any other single data point. To calculate it, you compare:
Article reading time vs. time on page + scroll depth
If you know how long it takes on average for users to read a piece of content, then you can compare that to the time they spent on the page to see if they were actually there long enough to read it. Then, confirm those metrics with how far users scrolled down the page on average.
For example, if “time on page” equals or is greater than “article reading time” and “scroll depth” is 75% or more, then you can infer that most users read it. I say 75% because most sites have a footer and/or additional info below where the main page content ends.
The content completion rate gives you the most accurate picture of how many users truly consumed the content.
Increase in Qualified Traffic:
Sounds great, but how do you measure it?
STEP 1
Look at month-over-month or quarter-over-quarter growth from organic traffic. If you’re publishing search-optimized content, that number should be on an upward trend. The exception is when you’re running a paid campaign with a big media budget, as that can significantly skew traffic source percentages.
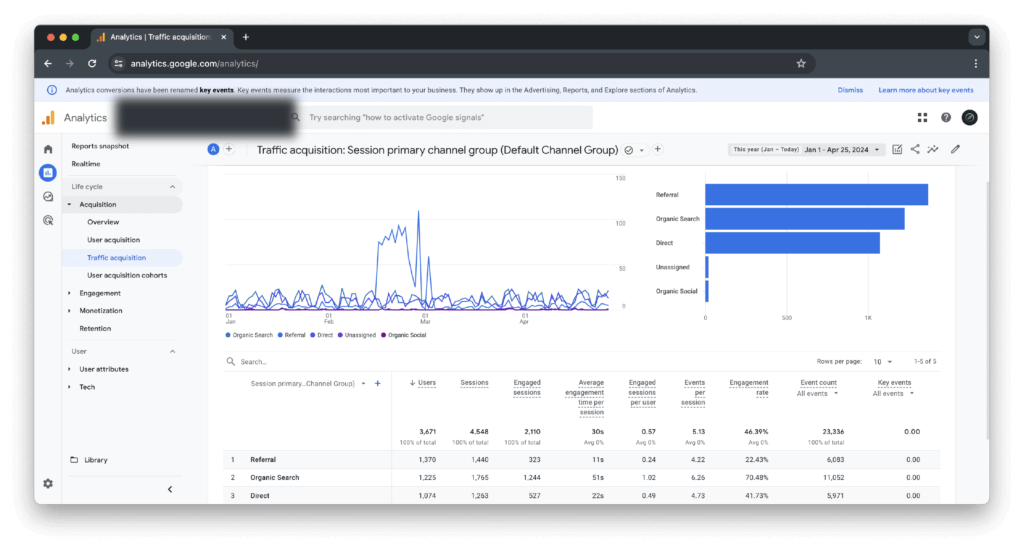
STEP 2
Look at how engagement rates compare from organic search against all other traffic sources, specifically for these KPIs:
- Session duration
- Bounce rate
- Scroll depth
I don’t need a crystal ball to tell you that those three KPIs from organic search traffic will almost always be much better than the same KPIs from all other traffic sources.
Making the Case for Content
With those tactics in place to assess user engagement with more meaningful analytics, you have the right tools to prove the value of your content.
Content is meant to deepen the relationship with prospects and customers by delivering value that makes your brand a more trusted resource in their minds and increasing the likelihood they will buy from you when the need arises for your products or services.
With more telling metrics that show the true value of content, you can get a better understanding of what’s working and make a compelling business case that your content is achieving exactly what it needs to be.
We can help create a strategy to create and measure content to get the attention of your prospect.